Draw Chart
Chart by DateTime column
- First column must be : Date or DateTime
- Use order by Date
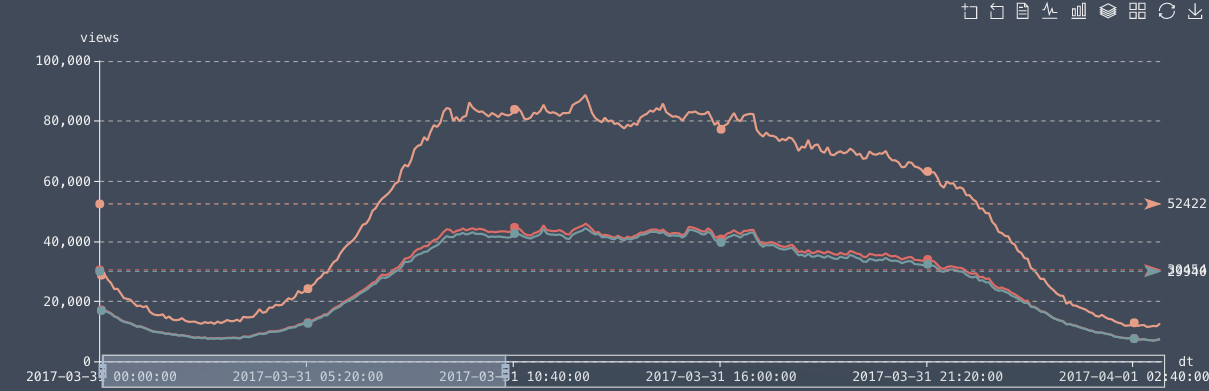
Chart & autoAxis
SELECT sin(number) as s,cos(number) as c,number
FROM system.numbers where number<12 LIMIT 12
DRAW_CHART
{
    xAxis:'number',
    yAxis:['s','c']
}
SELECT sin(number) as s,cos(number) as c,number
FROM system.numbers where number<12 LIMIT 12
DRAW_CHART
{
    xAxis:'number',
    yAxis:'s'
}
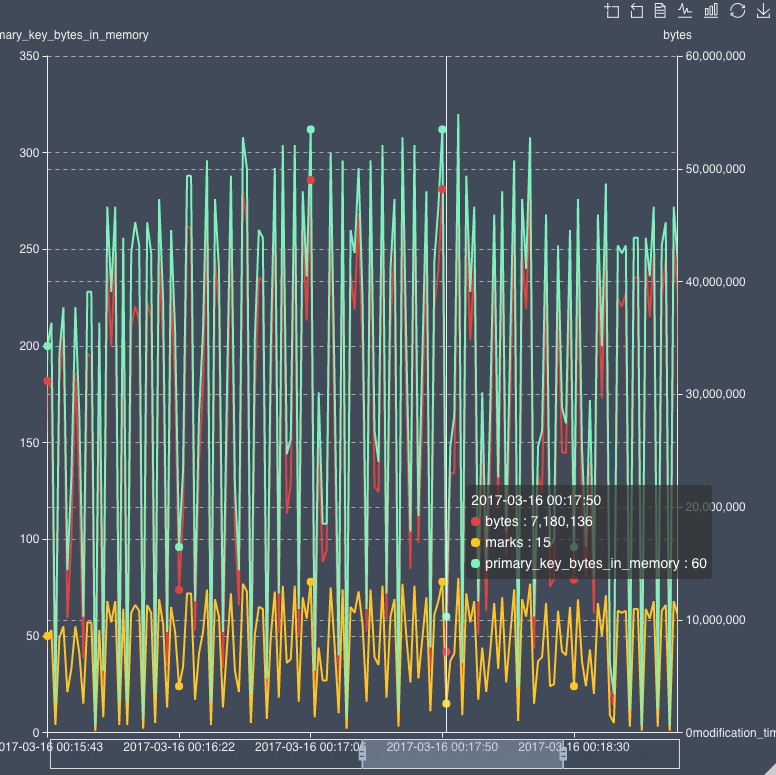
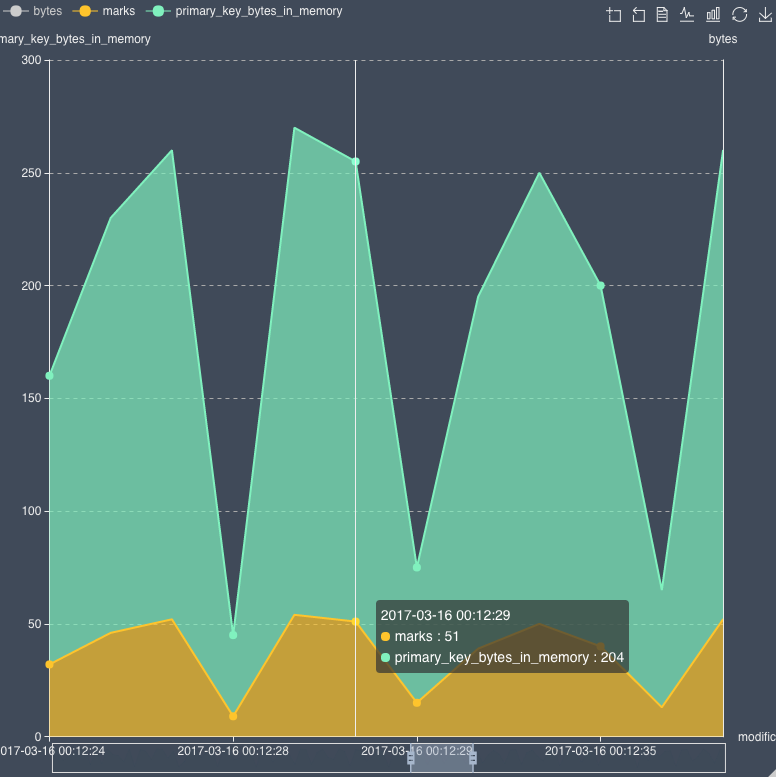
SELECT toStartOfFiveMinute( modification_time) as modification_time, sum(bytes) as bytes,sum(marks) as marks,table
FROM system.parts
group by modification_time,table
order by modification_time LIMIT 1000
DRAW_CHART
{
    autoAxis:true
}
autoAxis:false
autoAxis - default is false
Chart & markLine
Draw median line
DRAW_CHART
{
    markLine:true
}
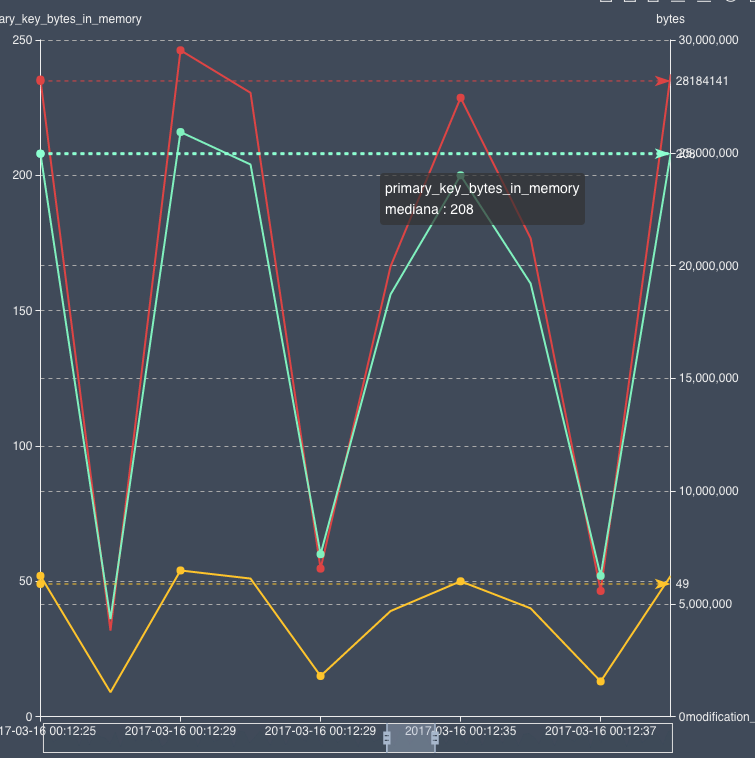
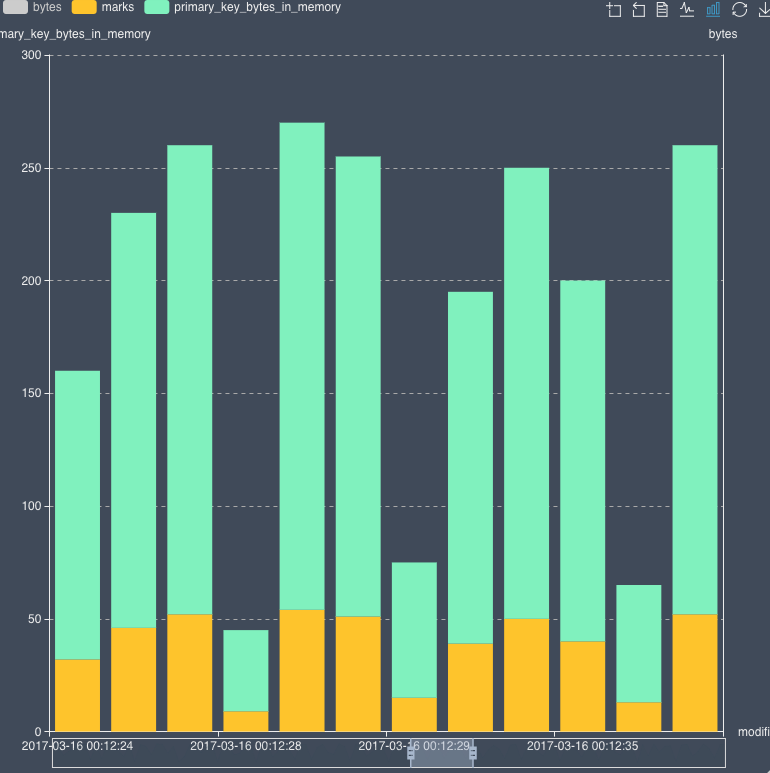
Chart & Stack
DRAW_CHART
{
    stack:true
}
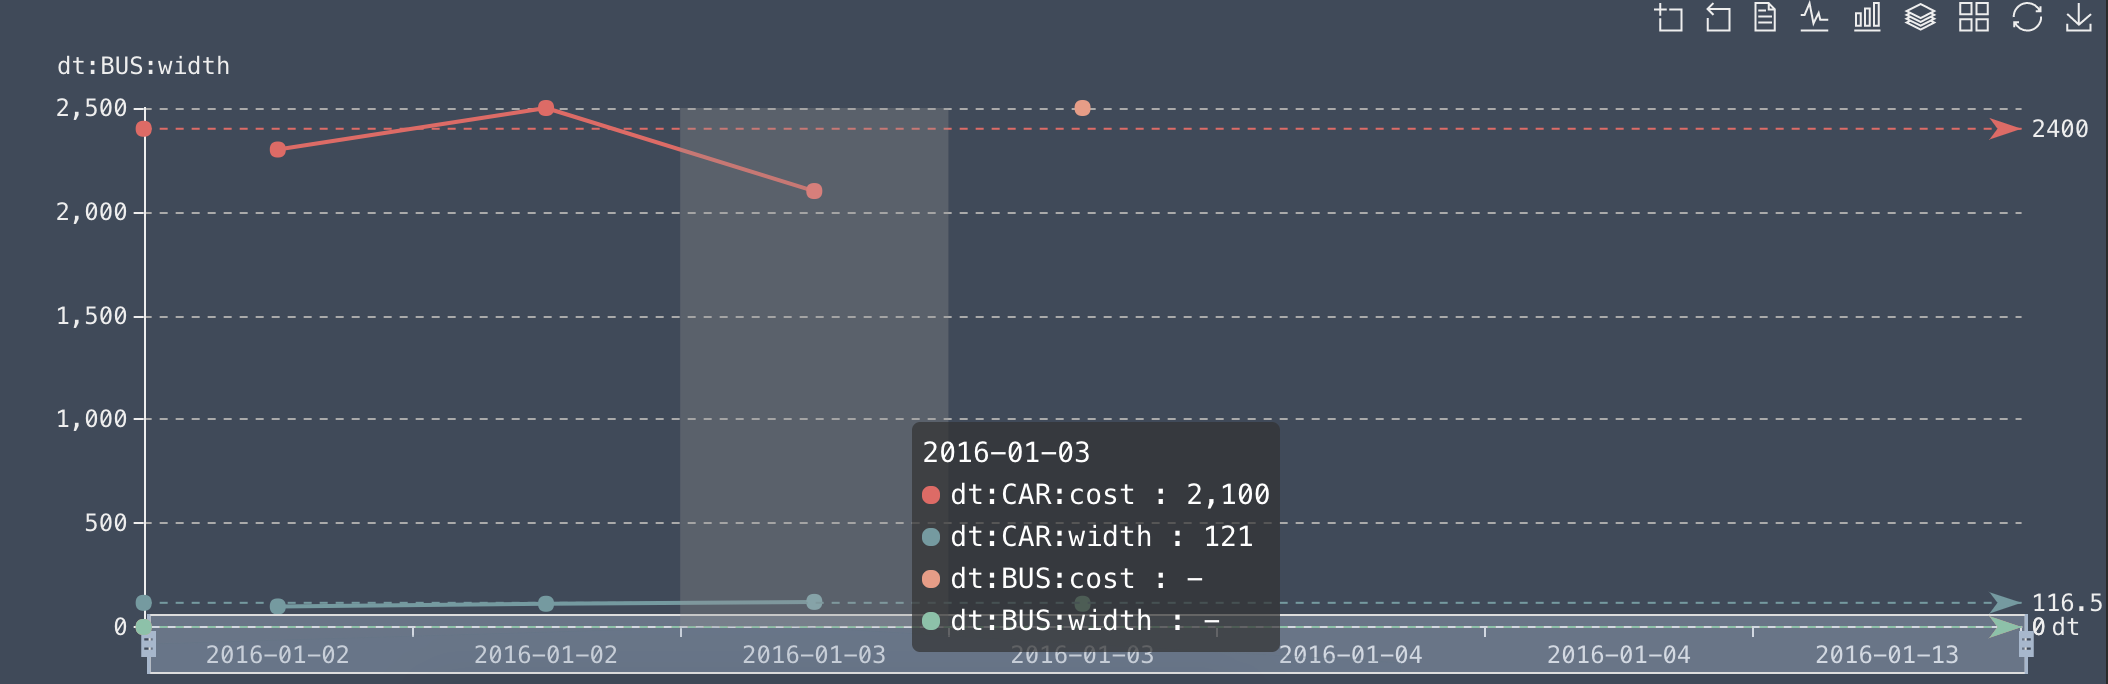
Group columns
Any string value becomes a group for the graph
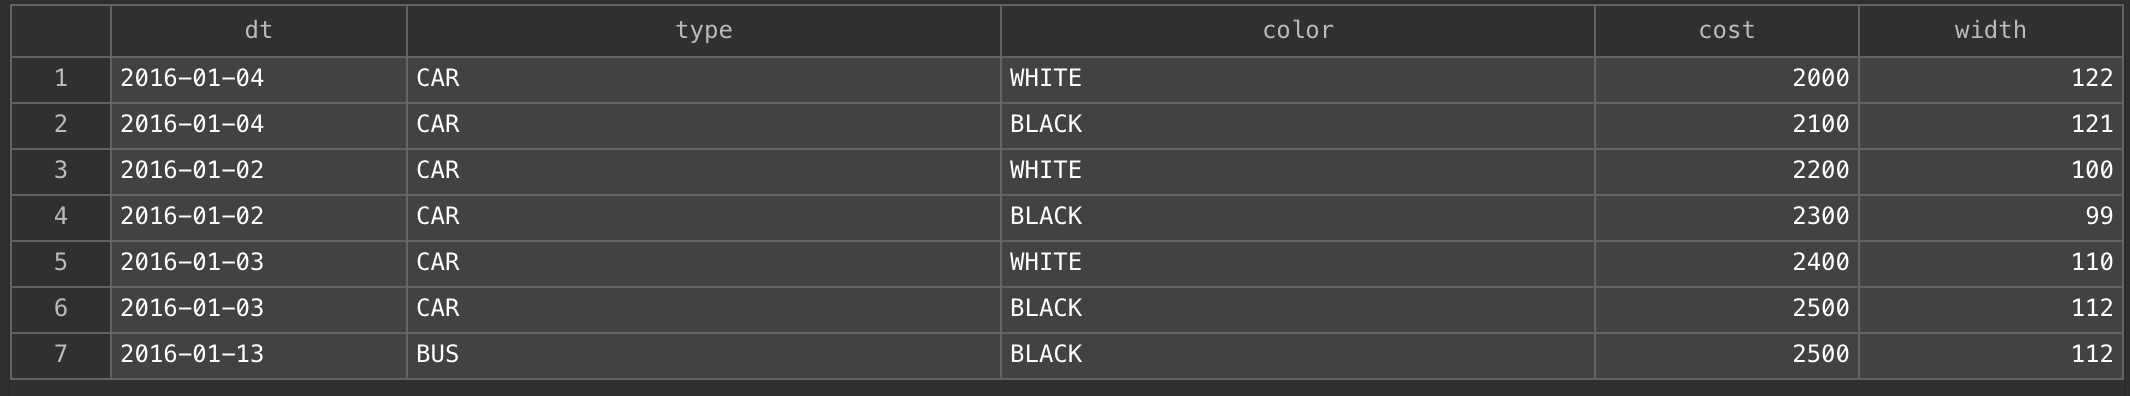
SELECT toDate( '2016-01-04') as dt,'CAR' as type,'WHITE' as color,toInt16(2000) as cost,122 as width
UNION ALL SELECT toDate( '2016-01-04') as dt,'CAR' as type,'BLACK' as color,toInt16(2100) as cost,121 as width
UNION ALL SELECT toDate( '2016-01-02') as dt,'CAR' as type,'WHITE' as color,toInt16(2200) as cost,100 as width
UNION ALL SELECT toDate( '2016-01-02') as dt,'CAR' as type,'BLACK' as color,toInt16(2300) as cost,99 as width
UNION ALL SELECT toDate( '2016-01-03') as dt,'CAR' as type,'WHITE' as color,toInt16(2400) as cost,110 as width
UNION ALL SELECT toDate( '2016-01-03') as dt,'CAR' as type,'BLACK' as color,toInt16(2500) as cost,112 as width
UNION ALL SELECT toDate( '2016-01-13') as dt,'BUS' as type,'BLACK' as color,toInt16(2500) as cost,112 as width
DRAW_CHART
{
   path:'type'
}
Custom chart
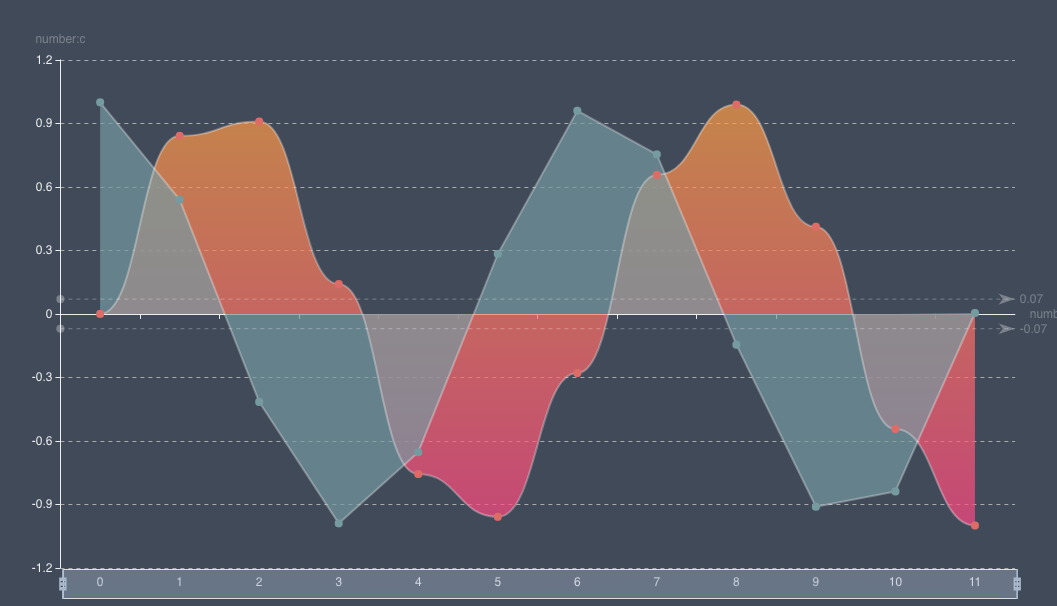
SELECT sin(number) as s,cos(number) as c,number
FROM system.numbers where number<12 LIMIT 12
DRAW_CHART
{
    xAxis:'number',
    yAxis:['s','c'],
    series:[
        {smooth:true,areaStyle: {
                normal: {
                    color: new echarts.graphic.LinearGradient(0, 0, 0, 1, [{
                        offset: 0,
                        color: 'rgb(255, 158, 68)'
                    }, {
                        offset: 1,
                        color: 'rgb(255, 70, 131)'
                    }])
                }
            }
        },
        {smooth:false,
            areaStyle: {
                normal: {}
            },
        }
    ]
}
Echart Doc
https://ecomfe.github.io/echarts-examples/public/editor.html?c=area-basic
https://ecomfe.github.io/echarts-doc/public/en/option.html#series-line