Draw Sankeys
SQL
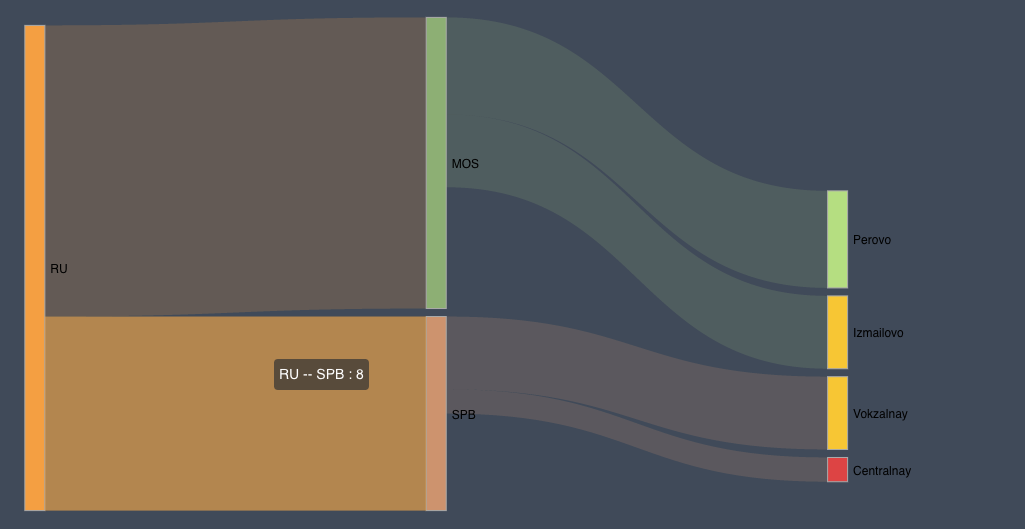
SELECT 'RU' as cntr,'MOS' as city,12 as value,'Izmailovo' as Street,3 as strval
UNION ALL
SELECT 'RU' as cntr,'MOS' as city,12 as value,'Perovo' as Street,4 as strval
UNION ALL
SELECT 'RU' as cntr,'SPB' as city,8 as value,'Centralnay' as Street,1 as strval
UNION ALL
SELECT 'RU' as cntr,'SPB' as city,8 as value,'Vokzalnay' as Street,3 as strval

DRAW_SANKEYS
{
    path:'cntr.value.city.strval.Street'
}
Echart API: * echarts-examples_sankey-energy * input_data
Transform
{
"nodes": [
        {
        "name": "Agricultural 'waste'"
        },
        {
        "name": "Bio-conversion"
        }
    ],
"links": [
    {
        "source": "Agricultural 'waste'",
        "target": "Bio-conversion",
        "value": 124.729
    },
    {
        "source": "Bio-conversion",
        "target": "Liquid",
        "value": 0.597
    }
    ]
}
Version 1
Convert table to forest :
| region | city | count_in_city | Street    | count_in_street |
| RU     | MSK  |  123123       | Shelkovo  |   1232          |
| RU     | SPB  |  93123        | Morskay   |   1211          |

=>

Format :

[ _source_ . _count_ . _target_ . _count2_ . _target2_


DRAW_SANKEY
{
"region.count_in_city.city.count_in_street.street"
}

or

DRAW_SANKEY
{
    path : "region.count_in_city.city.count_in_street.street",
}

or
DRAW_SANKEY
"region.count_in_city.city.count_in_street.street"
Version 2
not set path, must set columns: source + target + value
| source | target |    value      |
| RU     | MSK    |    1232       |
| RU     | SPB    |    1211       |

=>

DRAW_SANKEY
{

}
Rename value
DRAW_SANKEY
{
    value:'my_count_column'
}