Draw Plotly
Plot.ly
Tabix render plot.ly chart if exists command DRAW_PLOTLY
Code after command :
{
    trace :{ },
    trace1:{ },
    trace2:{ },
    trace3:{ },
    trace4:{ },
    layout:{ }
}
Plot.Ly Docs
- JS lib https://plot.ly/javascript/
https://help.plot.ly/tutorials/
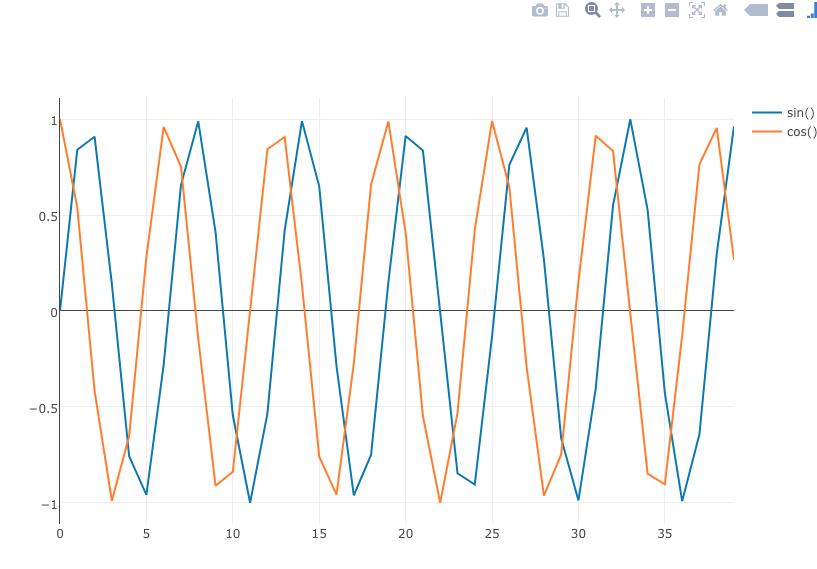
Scatter
select number as nu,
sin(number) as s,
cos(number) as c
from system.numbers limit 40
DRAW_PLOTLY {
    trace:{x:data.nu,y:data.s,type:'scatter',name:'sin()'},
    trace1:{x:data.nu,y:data.c,type:'scatter',name:'cos()'}
}
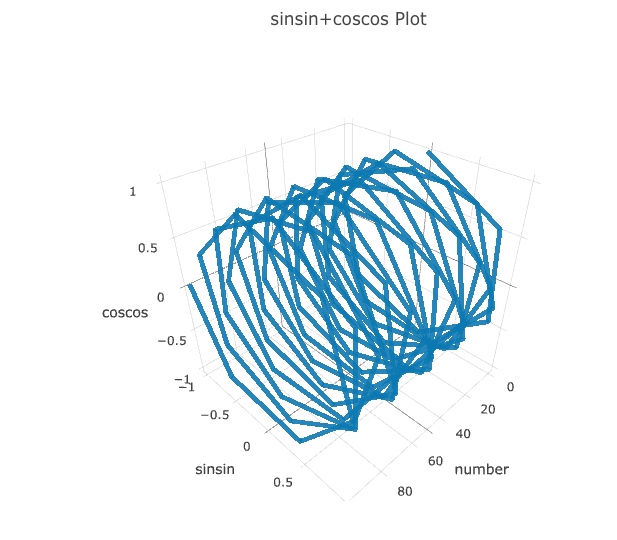
3D
select number as nu,
      sin(number) as s,
      cos(number) as c
      from system.numbers limit 100
DRAW_PLOTLY {
          trace:{
              z:data.c,
              x:data.nu,
              y:data.s,
              mode: 'lines',
              type:'scatter3d',
              opacity:0.9,
                  line: {
                      width: 10,
                      reversescale: false
                  }
          },
          layout : {
              title: 'sinsin+coscos Plot',
              showlegend: false,
              autosize: true,
                scene: {
                  xaxis: {title: 'number'},
                  yaxis: {title: 'sinsin'},
                  zaxis: {title: 'coscos'}
                  }
          }

      }
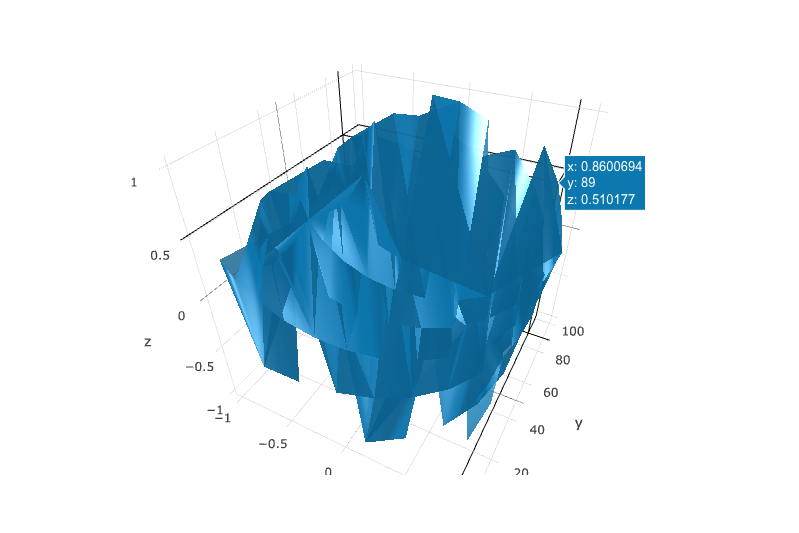
mesh3d
select number as nu,
sin(number) as s,
cos(number) as c
from system.numbers limit 100
DRAW_PLOTLY {
    trace:{x:data.s,y:data.nu,z:data.c,type:'mesh3d',opacity:0.8}

}
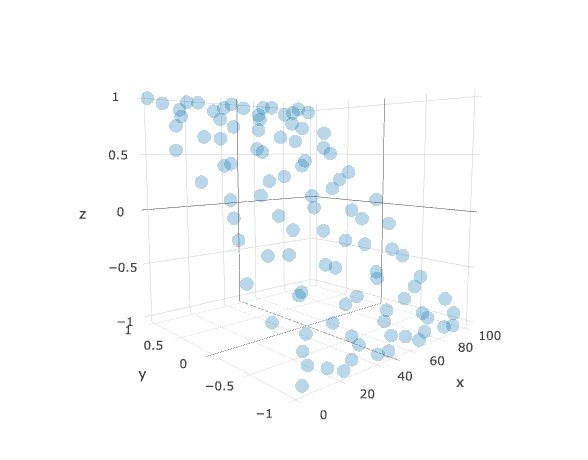
3D scatter3d + markers
select number as nu,
sin(number) as s,
cos(number) as c
from system.numbers limit 100
DRAW_PLOTLY {
    trace:{
    z:data.c,
    x:data.nu,
    y:data.c,
    mode: 'markers',
    type:'scatter3d',opacity:0.3}

}